FAQ: How WIS Decides Outcomes of Each PA Topic

Re-reading this thread also has me curious about a park like Dodger Stadium. If I'm reading correctly, Dodger Stadium should give up a lot more hits than an average park based on it's +2 singles rating, but fewer XBH due to the remaining factors. So why do hitters routinely produce lower BA in Dodger Stadium? Also, the general consensus seems to be that range isn't as important in a pitcher's park due to fewer balls being put in play, but wouldn't parks like Dodger Stadium (+2 singles), Comerica Park (+1 singles) etc. lead to more balls in play, thus putting greater emphasis on range?

Perhaps a better question is, from a WIS perspective, do "pitcher's park" and "hitter's park" need to be redefined based on the in-game singles rating, as opposed to how we think of them in real life?
7/17/2017 1:15 PM
'So why do hitters routinely produce lower BA in Dodger Stadium? '

The fact that this is true (and it certainly is from my experience) would seem to indicate that either:
A) The park effects don't quite work as generally assumed
B) The park effects are 'broken'

I'd be really interested in hearing other viewpoints on this.

(I swear if I ever win another TOC I'm going to run a league with identical teams half in Dodger stadium and half the teams in WIS stadium no inter-league play and post the resulting stats)
7/17/2017 1:59 PM
Posted by Jtpsops on 7/17/2017 1:15:00 PM (view original):
Re-reading this thread also has me curious about a park like Dodger Stadium. If I'm reading correctly, Dodger Stadium should give up a lot more hits than an average park based on it's +2 singles rating, but fewer XBH due to the remaining factors. So why do hitters routinely produce lower BA in Dodger Stadium? Also, the general consensus seems to be that range isn't as important in a pitcher's park due to fewer balls being put in play, but wouldn't parks like Dodger Stadium (+2 singles), Comerica Park (+1 singles) etc. lead to more balls in play, thus putting greater emphasis on range?

Perhaps a better question is, from a WIS perspective, do "pitcher's park" and "hitter's park" need to be redefined based on the in-game singles rating, as opposed to how we think of them in real life?
So no one has any input on this? What happened to all the experts around here?
8/15/2017 10:07 AM
I never saw any evidence of hitters "routinely" producing lower AVG in Dodger Stadium. I went through a phase of using Dodger Stadium a lot and almost all my teams had higher home batting averages than away and those teams finished in the top 2 or 3 in total hits all those seasons. Getting hits in Dodger was never a problem. Having a higher road batting average while using Dodger Stadium does not automatically equate to "Dodger Stadium is broken."

As for the pitcher's park vs. hitter's park question, it depends on how you're defining what makes a park one or the other. Exhibition Stadium is one of my favorite parks. It has a 1B rating of -2, which might make some people instantly say "pitcher's park", but it's +2 for 2B and 3B and +1 for HR. I've built 1000-run offenses in that park even with its negative 1B rating because those offenses were tailored to take advantage of the increase in XBH rates. If used correctly, I'd call it a hitter's park. I think there's really only the few obvious parks on either end of the spectrum, like Coors/Mile High as hitter's parks and Petco/Safeco as pitcher's parks. Almost any other park can go either way depending on how the roster is built for it. The 1B rating doesn't automatically make a park one thing or another.
8/15/2017 5:56 PM
" I never saw any evidence of hitters "routinely" producing lower AVG in Dodger Stadium. I went through a phase of using Dodger Stadium a lot and almost all my teams had higher home batting averages than away and those teams finished in the top 2 or 3 in total hits all those seasons. Getting hits in Dodger was never a problem. Having a higher road batting average while using Dodger Stadium does not automatically equate to "Dodger Stadium is broken." "

Agreed, I like Dodger Stadium cuz I feel you dont need to worry about outfield range in that stadium. But you can still field high average teams and do well. I just focus on SB in that park tho.
8/15/2017 7:38 PM
Without analyzing what kind of roster the teams had, I'll take a look at some Dodgers teams in progressive leagues I'm currently in. Here is the AVG/OBP/SLG at home (left) and road (right), skipping around between a few seasons to allow roster variability:

HockeyHead 1977 Progressive team in Dodger Stadium:
1977 batting: Home: .277, .341, .393 Road: .279, .347, .421
1977 pitching: Home: .243, .311, .339 Road: .260, .330, .387
1982 batting: Home: .254, .323, .371 Road: .274, .344, .432
1982 pitching: Home: .292, .357, .412 Road: .313, .369, .462
1987 batting: Home: .263, .337, .426 Road: .277, .358, .428
1987 pitching: Home: .257, .321, .382 Road: .256, .317, .386
Franchise With Farm System:
1977 batting: Home: .286, .350, .423 Road: .285, .356, .443
1977 pitching: Home: .259, .319, .365 Road: .260, .324, .391
1982 batting: Home: .267, .333, .388 Road: .282, .342, .394
1982 pitching: Home: .243, .301, .339 Road: .274, .323, .409
Average: Home: .264, .329, .384 Road: .276, .341, .415

So in close to 30,000 AB, the road batting average is 12 points higher and road slugging percentage is 31 points higher. In a few seasons, the home-road splits are close to neutral, in other seasons the numbers are noticeably higher on the road. The larger effect on slugging percentage than on batting average is at least consistent with extra base hits being suppressed in Dodger Stadium more than singles. I wish there was an easier way to run the numbers on more seasons.
8/15/2017 11:32 PM
I am not sold that the singles rating indicates anything different than the ratings for doubles, triples, or HRs. My understanding is that the +/- numbers reflect impact to the % of hits that end up of that type. I.e. if someone hits 40 HRs but plays in a park that is -4/-4 for HRs, those HRs wouldn't turn into outs; some would stay HRs but the rest would rather be redistributed between singles, doubles, and triples, based on a combination of the player's likelihood to end up with one of the other three types of hit and the +/- for each type of hit in that park.

I don't have hard data to back this up, just general observations and it's my reading of the first post in this thread, as well.
8/16/2017 11:39 PM
A PA is determined to result in a hit before it is determined which type of hit. The "hit or not" calculation was said to be influenced by the "hits multiplier". What this "hits multiplier" is was not explicitly stated, but I interpreted that it meant the 1B rating of the park, because the 1B rating was mentioned nowhere else in determining what type of hit resulted after a hit was determined to be the outcome. The only ratings mentioned in determining what type of hit were the HR, 3B, and 2B ratings. Any hit not determined to be a 2B, 3B, or HR of course ends up as just a single, so the 1B rating can really only have an influence at the point of the decision tree which determines if the PA results in ANY kind of hit. That was my understanding, anyway.
8/16/2017 11:51 PM
Contrarian's OP does a good job of summarizing the content of the Powerpoint slides this information originally came from, but it does not preserve the language of the slides themselves, and as written I think it can change the way that information is interpreted. I have no image of the Powerpoints anymore, but I do remember very specifically that Step 4 used the "hits multiplier" and that Step 9 mentioned the 2B and 3B ratings but the 1B rating was specifically absent from that step. That's why I thought "hits multiplier" could only refer to the 1B rating.
8/16/2017 11:55 PM
That's definitely a strong case and I'm not going to steadfastly disagree; you may very well be right. It would be weird for the 1B to casually just not be mentioned. At the same time, if that's true, it would be more clear to classify it differently than the +/- ratings for other types of hits, rather than side by side with the other hits.

In practice, I don't think there is a huge impact either way (and all the analysis we could do with the limited amount of played seasons at our disposal wouldn't be conclusive), since the amount of hits that would turn into any given type wouldn't drastically change depending on which way it was determined, but it would be interesting to get clarity, since I think the point here is that we don't have it.
8/17/2017 12:17 AM
So skunk206, your interpretation is that a park with a 0 rating for singles should have no systematic home-road difference in batting average, regardless of the ratings for 2B, 3B, or HR? I see that in the listing of ballpark dimensions and effects, the last column is labeled "Park Factor". Its values range from 0.82 (Petco) to 1.37 (Coors). I haven't seen the Powerpoint slides that motivated the first post in this thread, but would guess that the Park Factor is the "hits multiplier". Most parks with 0 ratings for singles do have Park Factors very near 1.00. Jack Murphy Stadium (0.90) and the Metrodome (1.07) might be good parks for trying to test this. My guess is the Metrodome inflates BA a bit because of extra 2B and 3B (+2 ratings for both), Jack Murphy hurts BA because of fewer 2B (-2) and to a lesser extent fewer 3B (-1) and HR (0/-1). BTW, the Park Factor for Dodger Stadium is 0.87, with 1B (+2), 2B (-4), 3B (-3), HR (-1/-1). That suggests to me a decreased BA at Dodger Stadium, and disproportionately more of the hits at Dodger Stadium being singles. That is consistent with the sim results I've looked at.
8/17/2017 1:14 AM
We were once told (can't remember which staffer did it) that the Park Factor was superfluous and had no meaning in the SIM. It was calculated somehow using data based on the park's real-life run production environment as a way to rank the parks in order, but it was not used in any SIM calculation. While it's true that there is some correlation that is obvious at the extremes between Park Factor and the effect on offensive production (like Petco at one end and Coors at the other), Park Factor by itself is not supposed to have influence on anything in SLB.

Dodger Stadium would produce a greater proportion of singles because the other XBH factors are all suppressive. But those were already determined to have been hits, so the negative XBH factors should have no influence on batting average. They should only influence what type of hit is produced after hit has been decided as the outcome.

I think the mistake is that some owners look at the 1B rating or the Park Factor and take it way too seriously and/or literally. If Dodger Stadium is +2 for 1B it does not mean that Dodger Stadium will always, every time, produce a higher home batting average than road, or that Dodger Stadium will always, every time, mean your hitters will hit for strong batting averages at home. There are way too many other variables that influence the game to say that individual park effects should always be noticeable on their own. A hitter can, and some will, have bad seasons in Coors. A hitter can, and some will, have good seasons in Petco. This can even happen on the whole-offense level since one simulated season is a tiny sample size in the sense of a statistical simulation.

The truth is that we don't know just how much influence park factors have. Even the ratings are misleading. A 0 rating could mean anything from -0.4 to 0.4, because we only see the rounded whole number. A rating of 1 could mean 0.5 or 1.4. That's quite a difference. There's variation even for ratings of the same number on how they impact the stat in question. This might be my fuzzy memory, but I recall a site staffer saying in a post that a park rating of 2 is not actually double the effect of a rating of 1. I think the example was that the Astrodome's -4 HR ratings didn't mean it suppressed HR at a rate 4 times greater than a -1 HR park.

8/17/2017 6:17 PM
Posted by dannyjoe on 8/15/2017 11:32:00 PM (view original):
Without analyzing what kind of roster the teams had, I'll take a look at some Dodgers teams in progressive leagues I'm currently in. Here is the AVG/OBP/SLG at home (left) and road (right), skipping around between a few seasons to allow roster variability:

HockeyHead 1977 Progressive team in Dodger Stadium:
1977 batting: Home: .277, .341, .393 Road: .279, .347, .421
1977 pitching: Home: .243, .311, .339 Road: .260, .330, .387
1982 batting: Home: .254, .323, .371 Road: .274, .344, .432
1982 pitching: Home: .292, .357, .412 Road: .313, .369, .462
1987 batting: Home: .263, .337, .426 Road: .277, .358, .428
1987 pitching: Home: .257, .321, .382 Road: .256, .317, .386
Franchise With Farm System:
1977 batting: Home: .286, .350, .423 Road: .285, .356, .443
1977 pitching: Home: .259, .319, .365 Road: .260, .324, .391
1982 batting: Home: .267, .333, .388 Road: .282, .342, .394
1982 pitching: Home: .243, .301, .339 Road: .274, .323, .409
Average: Home: .264, .329, .384 Road: .276, .341, .415

So in close to 30,000 AB, the road batting average is 12 points higher and road slugging percentage is 31 points higher. In a few seasons, the home-road splits are close to neutral, in other seasons the numbers are noticeably higher on the road. The larger effect on slugging percentage than on batting average is at least consistent with extra base hits being suppressed in Dodger Stadium more than singles. I wish there was an easier way to run the numbers on more seasons.
have been reading this thread to form opinions on contrarian's theme league here (https://www.whatifsports.com/forums/Posts.aspx?topicID=518905) and I think this post would seem to disprove the theory that the singles rating for the park is used in the step to determine hit or out.

I was confused for a while as to why the singles rating isn't mentioned in step 9 of the WIS presentation, but thinking about it, the reason is you only need two of the singles, doubles and triples park factor to arrive at the final answer in step 9.

Example: let's say you've gotten to step 9 and know it's a non-home run hit, and after the individual pitcher/hitter match-up is calculated you have 70% single, 20% double, 10% triple. now you need to take the ballpark into account. let's say the doubles factor is 0.8 and the triples factor is 1.25. now you 16% double and 12.5% triple, and it follows single is now 71.5%. so the singles factor is 71.5/70 = 1.0214. You could just as easily have started with only the singles and doubles factors and derived the triples factor, or only the singles and triples factors and derived the doubles factor.

Also the WIS presentation list the relative hitter/pitcher impact on 2B/hit and 3B/hit but not 1B/hit for similar reasons. In fact, you can only adjust two of the three, because the cumulative probability needs to sum to exactly 1. If you increase the probability of a double and the probability of a triple, then the probability of a single must decrease. If you adjusted all three independently of each other, the probability wouldn't sum to 1 and the code would break.

Based on this, here is my theory on how the park effects work:

1. In the hit or out step, some secret overall park-specific factor is applied. This should not be the park factor listed on the ballparks page by WIS, because the overall impact of the park on scoring depends not just on the total probability of a hit, but also the distribution of potential hits (a team hitting .250 with all home runs is going to score a lot more runs than a team hitting .300 with all singles). And anyways, WIS has apparently told us the park factor doesn't matter. My guess would be WIS derived this from batting average at each park vs the league average.

2. In the home run or non-home run step, the park-specific HR factor is applied.

3. In the step where a non-home run hit is split into single, double or triple, the park-specific doubles factor and the park-specific triples factor are applied. The park-specific singles factor can then be derived as described above.

If this theory is correct, it must mean that the rating for single, double, and triple displayed on the ballparks page represent the secret overall park factor multiplied by the park-specific factor used in step 3 above. It cannot be just the factors in step 3 alone, because then you couldn't have something like Hilltop(+3 1B, +3 2B, + 3 3B) or Safeco (-2 1B, -2 2B, -1 3B); the probabilities would not sum to 1. Since the home run factor is independent of everything else, the effect listed could be the HR factor by itself or it could be the HR factor multiplied by the overall park factor.
3/13/2020 8:45 PM
I recently found an old hard drive of mine and it had the power point presentations referenced above. I've uploaded them into Google Slides and have both presentations linked below:

The Inputs

The Outputs
9/12/2020 11:58 AM (edited)
Posted by 06gsp on 3/13/2020 8:45:00 PM (view original):
Posted by dannyjoe on 8/15/2017 11:32:00 PM (view original):
Without analyzing what kind of roster the teams had, I'll take a look at some Dodgers teams in progressive leagues I'm currently in. Here is the AVG/OBP/SLG at home (left) and road (right), skipping around between a few seasons to allow roster variability:

HockeyHead 1977 Progressive team in Dodger Stadium:
1977 batting: Home: .277, .341, .393 Road: .279, .347, .421
1977 pitching: Home: .243, .311, .339 Road: .260, .330, .387
1982 batting: Home: .254, .323, .371 Road: .274, .344, .432
1982 pitching: Home: .292, .357, .412 Road: .313, .369, .462
1987 batting: Home: .263, .337, .426 Road: .277, .358, .428
1987 pitching: Home: .257, .321, .382 Road: .256, .317, .386
Franchise With Farm System:
1977 batting: Home: .286, .350, .423 Road: .285, .356, .443
1977 pitching: Home: .259, .319, .365 Road: .260, .324, .391
1982 batting: Home: .267, .333, .388 Road: .282, .342, .394
1982 pitching: Home: .243, .301, .339 Road: .274, .323, .409
Average: Home: .264, .329, .384 Road: .276, .341, .415

So in close to 30,000 AB, the road batting average is 12 points higher and road slugging percentage is 31 points higher. In a few seasons, the home-road splits are close to neutral, in other seasons the numbers are noticeably higher on the road. The larger effect on slugging percentage than on batting average is at least consistent with extra base hits being suppressed in Dodger Stadium more than singles. I wish there was an easier way to run the numbers on more seasons.
have been reading this thread to form opinions on contrarian's theme league here (https://www.whatifsports.com/forums/Posts.aspx?topicID=518905) and I think this post would seem to disprove the theory that the singles rating for the park is used in the step to determine hit or out.

I was confused for a while as to why the singles rating isn't mentioned in step 9 of the WIS presentation, but thinking about it, the reason is you only need two of the singles, doubles and triples park factor to arrive at the final answer in step 9.

Example: let's say you've gotten to step 9 and know it's a non-home run hit, and after the individual pitcher/hitter match-up is calculated you have 70% single, 20% double, 10% triple. now you need to take the ballpark into account. let's say the doubles factor is 0.8 and the triples factor is 1.25. now you 16% double and 12.5% triple, and it follows single is now 71.5%. so the singles factor is 71.5/70 = 1.0214. You could just as easily have started with only the singles and doubles factors and derived the triples factor, or only the singles and triples factors and derived the doubles factor.

Also the WIS presentation list the relative hitter/pitcher impact on 2B/hit and 3B/hit but not 1B/hit for similar reasons. In fact, you can only adjust two of the three, because the cumulative probability needs to sum to exactly 1. If you increase the probability of a double and the probability of a triple, then the probability of a single must decrease. If you adjusted all three independently of each other, the probability wouldn't sum to 1 and the code would break.

Based on this, here is my theory on how the park effects work:

1. In the hit or out step, some secret overall park-specific factor is applied. This should not be the park factor listed on the ballparks page by WIS, because the overall impact of the park on scoring depends not just on the total probability of a hit, but also the distribution of potential hits (a team hitting .250 with all home runs is going to score a lot more runs than a team hitting .300 with all singles). And anyways, WIS has apparently told us the park factor doesn't matter. My guess would be WIS derived this from batting average at each park vs the league average.

2. In the home run or non-home run step, the park-specific HR factor is applied.

3. In the step where a non-home run hit is split into single, double or triple, the park-specific doubles factor and the park-specific triples factor are applied. The park-specific singles factor can then be derived as described above.

If this theory is correct, it must mean that the rating for single, double, and triple displayed on the ballparks page represent the secret overall park factor multiplied by the park-specific factor used in step 3 above. It cannot be just the factors in step 3 alone, because then you couldn't have something like Hilltop(+3 1B, +3 2B, + 3 3B) or Safeco (-2 1B, -2 2B, -1 3B); the probabilities would not sum to 1. Since the home run factor is independent of everything else, the effect listed could be the HR factor by itself or it could be the HR factor multiplied by the overall park factor.
From a different thread, but relevant, so reposting:


-4 -3 -2 -1 0 +1 +2 +3 +4
1B x x 0.908 x 1.000 x x 1.182
2B 0.795 x x x 1.000 x x x 1.291
3B x 0.523 x x 1.000 x x x 1.868
HR/L 0.634 x x x 1.000 x x x 1.385
HR/R 0.636 x x x 1.000 x x x 1.374
PF 0.820 x x 1.000 x x x 1.370
-4 -3 -2 -1 0 +1 +2 +3 +4
1B 0.816 0.862 0.908 0.954 1.000 1.046 1.092 1.138 1.184
2B 0.800 0.850 0.900 0.950 1.000 1.050 1.100 1.150 1.200
3B 0.400 0.550 0.700 0.850 1.000 1.150 1.300 1.450 1.700
HR/L 0.680 0.760 0.840 0.920 1.000 1.080 1.160 1.240 1.320
HR/R 0.680 0.760 0.840 0.920 1.000 1.080 1.160 1.240 1.320
PF 0.800 0.850 0.900 0.950 1.000 1.050 1.100 1.150 1.200

I'm going to use the same example Paul used in his presentation, then add in the modifiers.

2000 Pedro Martinez vs 1923 Babe Ruth:
[H/AB=((AVG*OAV)/Lgavg)/((AVG*OAV)/LgAVG+(1-AVG)*(1-OAV)/(1-LGAVG))
Where, LgAVG=(PLgAVG+BLgAVG)/2]
Thus: H/AB=((.393*.167)/.2791)/((.393*.167)/.2791+(1-.393)*(1-.167)/(1-.2791))
Where, LgAVG=(.283+.276)/2], or .2791

Log5 result = .2504 This is the expected AVG for Ruth or OAV for Pedro in this matchup including normalization. If they had both been lefties or righties we then would've used the handedness modifier (new result would have been .2379, but that doesn't apply here). So in this case we apply the hit modifier (1B effect). For Coors that's a multiplier of 1.182, and the new result is .2959, for a -3 Park, like Petco, our modifier range is .862-.908, so in a worst case, that would be the original .2504*.862, or .
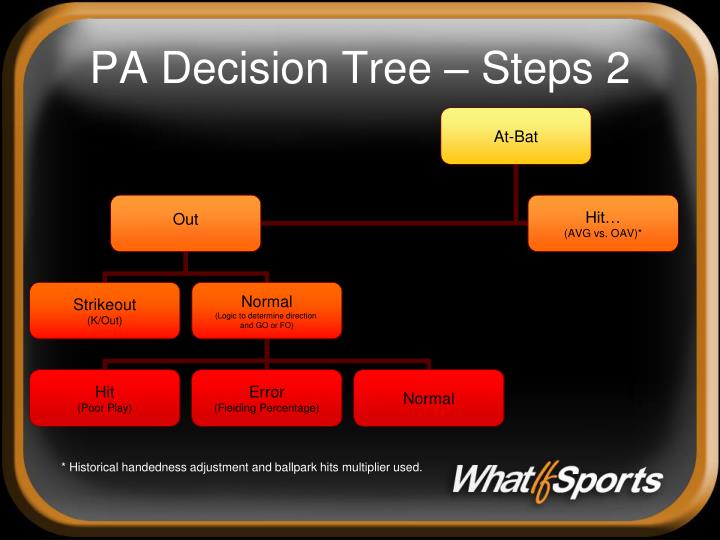
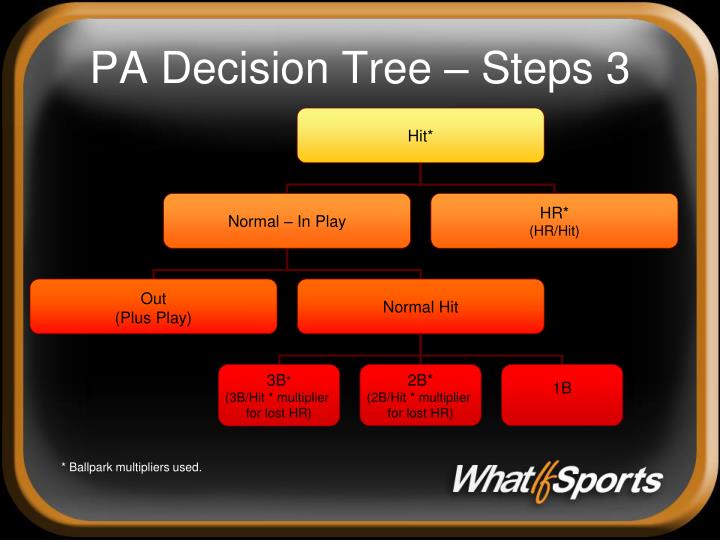
2158. The next step if it is a hit is to determine what type of hit. WIS works backwards and starts with HR. The HR/H rate is calculated the same way as the H/AB but instead of AVG, OAV, LgAVG we use bHR/H, pHR/H, and LHR/H.

Thus: HR/H=((.200*.132)/.0805)/((.200*.132)/.0805+(1-.200)*(1-.132)/(1-.0805))
Where, LgHR/H=(.124+.037)/2], or .0805
Log5 result = .3027 (roughly 30% of the hits Ruth gets off of Pedro will be HRs. Now, in Coors, this wold be multiplied by the HR/RF (Sim assumes pull for hitter in calculations), so we take the .3027 and multiply the HR modifier of 1.374 to get a park adjusted rate of .4159 or roughly 41 HR per 100 hits off of Pedro in Coors.

This is HR/H, not HR/AB. The HR/AB for this matchup is simply multiplying the H/AB rate by the HR/H rate. (.2959*.4159) for a HR/AB of .1230 in Coors. In Petco we'd start with the -3 modifier (which puts us somewhere between .64-.76, so we'll use .7 for our estimate) and multiply the original outcome of .3027 by .7 to get the park adjusted HR/H rate of .2118 or roughly 21 HR per 100 hits or a (.2158*.2118) .0457 HR/AB in Petco (12.3 HR/AB in Coors & 4.57 HR/AB in Petco for this particular Batter/Pitcher matchup (7.58 HR/AB in neutral park)).

If it's not a HR, then using a regression from the pitcher ERA and the batters 3B/H and 2B/H, the SIM works to see if it's a + play on defense , or a triple or double the same as the HR above and uses the park effects the same way. Any hits that didn't become HR, + play, 3B, or 2B are singles.

*Does not include handedness adjustment or batter/pitcher weighting as displayed in "The Outputs" link in the prior post.
9/26/2020 12:10 PM (edited)
◂ Prev 1234 Next ▸
FAQ: How WIS Decides Outcomes of Each PA Topic

Search Criteria

Terms of Use Customer Support Privacy Statement

© 1999-2024 WhatIfSports.com, Inc. All rights reserved. WhatIfSports is a trademark of WhatIfSports.com, Inc. SimLeague, SimMatchup and iSimNow are trademarks or registered trademarks of Electronic Arts, Inc. Used under license. The names of actual companies and products mentioned herein may be the trademarks of their respective owners.