Exploring Park Effects Topic

Through 60 games:
Team Park Games PA H HR 3B 2B XBH 1B
90 Ft from Home AFCS 60 2230 479 35 25 82 142 337
AFCS Project AFCS 60 2210 468 37 26 74 137 331
Pythagorean Triples AFCS 60 2257 540 46 27 78 151 389
She's So Ugly AFCS 60 2325 589 51 50 92 193 396
SpottieOttie AFCS 60 2344 557 39 37 80 156 401
The Trouble With Triples AFCS 60 2262 491 38 21 69 128 363
Three Men on Third AFCS 60 2268 540 45 29 86 160 380
Triples in AFC AFCS 60 2275 501 41 33 61 135 366
Born on Third Base Petco 60 2343 530 26 63 94 183 347
Magda, Zsa Zsa, and Eva Petco 60 2255 472 27 52 68 147 325
MH Will Prob Trip Petco 60 2236 466 16 55 62 133 333
Petco Project Petco 60 2251 472 20 73 66 159 313
Petco's Festival of Triples Petco 60 2228 441 25 52 68 145 296
Roustabouts@Petco Petco 60 2226 467 22 63 67 152 315
Run Run Run Petco 60 2223 457 25 57 57 139 318
Sliding Headfirst Into Third Petco 60 2270 470 19 50 62 131 339
Totals 36203 7940 512 713 1166 2391 5549
Averages 2262.6875 496.25 32 44.5625 72.875 149.438 346.813
Total AFCS 18171 4165 332 248 622 1202 2963
Average AFCS 2271.375 520.625 41.5 31 77.75 150.25 370.375
Total Petco 18032 3775 180 465 544 1189 2586
Average Petco 2254 471.875 22.5 58.125 68 148.625 323.25
4/25/2020 8:46 PM
Team Park H/PA HR/PA 3B/PA 2B/PA XBH/PA 1B/PA
90 Ft from Home AFCS 0.215 0.016 0.011 0.037 0.064 0.151
AFCS Project AFCS 0.212 0.017 0.012 0.033 0.062 0.150
Pythagorean Triples AFCS 0.239 0.020 0.012 0.035 0.067 0.172
She's So Ugly AFCS 0.253 0.022 0.022 0.040 0.083 0.170
SpottieOttie AFCS 0.238 0.017 0.016 0.034 0.067 0.171
The Trouble With Triples AFCS 0.217 0.017 0.009 0.031 0.057 0.160
Three Men on Third AFCS 0.238 0.020 0.013 0.038 0.071 0.168
Triples in AFC AFCS 0.220 0.018 0.015 0.027 0.059 0.161
Born on Third Base Petco 0.226 0.011 0.027 0.040 0.078 0.148
Magda, Zsa Zsa, and Eva Petco 0.209 0.012 0.023 0.030 0.065 0.144
MH Will Prob Trip Petco 0.208 0.007 0.025 0.028 0.059 0.149
Petco Project Petco 0.210 0.009 0.032 0.029 0.071 0.139
Petco's Festival of Triples Petco 0.198 0.011 0.023 0.031 0.065 0.133
Roustabouts@Petco Petco 0.210 0.010 0.028 0.030 0.068 0.142
Run Run Run Petco 0.206 0.011 0.026 0.026 0.063 0.143
Sliding Headfirst Into Third Petco 0.207 0.008 0.022 0.027 0.058 0.149
Totals
Averages 0.219 0.014 0.020 0.032 0.066 0.153
Total AFCS
Average AFCS 0.229 0.018 0.014 0.034 0.066 0.163
Total Petco
Average Petco 0.209 0.010 0.026 0.030 0.066 0.143
4/25/2020 8:47 PM
Team Park HR/H 3B/H 2B/H XBH/H 1B/H
90 Ft from Home AFCS 0.073 0.052 0.171 0.296 0.704
AFCS Project AFCS 0.079 0.056 0.158 0.293 0.707
Pythagorean Triples AFCS 0.085 0.050 0.144 0.280 0.720
She's So Ugly AFCS 0.087 0.085 0.156 0.328 0.672
SpottieOttie AFCS 0.070 0.066 0.144 0.280 0.720
The Trouble With Triples AFCS 0.077 0.043 0.141 0.261 0.739
Three Men on Third AFCS 0.083 0.054 0.159 0.296 0.704
Triples in AFC AFCS 0.082 0.066 0.122 0.269 0.731
Born on Third Base Petco 0.049 0.119 0.177 0.345 0.655
Magda, Zsa Zsa, and Eva Petco 0.057 0.110 0.144 0.311 0.689
MH Will Prob Trip Petco 0.034 0.118 0.133 0.285 0.715
Petco Project Petco 0.042 0.155 0.140 0.337 0.663
Petco's Festival of Triples Petco 0.057 0.118 0.154 0.329 0.671
Roustabouts@Petco Petco 0.047 0.135 0.143 0.325 0.675
Run Run Run Petco 0.055 0.125 0.125 0.304 0.696
Sliding Headfirst Into Third Petco 0.040 0.106 0.132 0.279 0.721
Totals
Averages 0.064 0.091 0.146 0.301 0.699
Total AFCS
Average AFCS 0.080 0.059 0.149 0.288 0.712
Total Petco
Average Petco 0.048 0.123 0.144 0.315 0.685
4/25/2020 8:47 PM
I understand about 25% of what's in this thread. I have to read it like seven more times to have it sink in fully.

Relative to how you've all been able to dissect the math behind the game, I'm still playing "hit ball good, miss ball bad" over here.
4/29/2020 12:09 PM
I found some of the info on the actual modifiers used (the ratings, i.e., -2/+4 are just UI placeholders to categorize the actual modifiers). There was often speculation as to whether they were rounded or truncated, and it turns out it’s neither.

I’m on mobile now, but next time on my PC, I’ll post the data. Each event (1B, 2B, 3B, HR) appears to be on a different scale. Just a quick estimate from eyeballing it, it looks like for 1B, each +/- 1 adds or subtracts roughly .033 to the modifier. So, after running through the batter/pitcher matchup and normalization, the HIT calculation for the 1,000 sided die is multiplied by 1, +/- .033 per 1. So if in a +2 1B park the result of the batter/pitcher log5 is multiplied by 1.066 or for a -2 park multiplied by .934. Again, this was from a quick eyeball estimate, but I’ll post actual data within next couple of days.
4/29/2020 6:36 PM
Posted by just4me on 4/29/2020 6:36:00 PM (view original):
I found some of the info on the actual modifiers used (the ratings, i.e., -2/+4 are just UI placeholders to categorize the actual modifiers). There was often speculation as to whether they were rounded or truncated, and it turns out it’s neither.

I’m on mobile now, but next time on my PC, I’ll post the data. Each event (1B, 2B, 3B, HR) appears to be on a different scale. Just a quick estimate from eyeballing it, it looks like for 1B, each +/- 1 adds or subtracts roughly .033 to the modifier. So, after running through the batter/pitcher matchup and normalization, the HIT calculation for the 1,000 sided die is multiplied by 1, +/- .033 per 1. So if in a +2 1B park the result of the batter/pitcher log5 is multiplied by 1.066 or for a -2 park multiplied by .934. Again, this was from a quick eyeball estimate, but I’ll post actual data within next couple of days.
So here's what I've got: during one of the infamous Paul Bessire presentations there was a slide for ballpark effects and it showed a number of effects and the modifiers used in the calculations of the slide on page 2 of this thread. Those numbers are represented in the top chart. The second chart would be the bounds for each rating on the ballpark effect scale for that hit event. Obviously these are estimated bounds, but these should give a VERY ACCURATE estimation if you were to plug these into the log5 formula for your batter/pitcher matchup as described in the slide from page 2.

I plugged everything exactly as you'd see it with the exception of Petco's hit modifier. In the original presentation this was a -2 and Petco had a Park Factor (Runs) of .830, now it is a -3 and Petco is displaying a Park Factor of .820. So, I have the extreme negative hit factor displayed in -2 instead of -3. This also helped keep the bounds for chart 2 tangible, as if the .908 was a -3, then all the other bounds would've been linear, but the hit (1B) factor would have been exponential and that wouldn't make sense. This shift to accommodate the change in Petco's rating over the first few seasons of its existence made everything else fit exceptionally well.

Hope these charts help understand the effect each modifier has on your batters performance for each ballpark in conjunction with the slide from the previous page and I'm happy to answer any questions or lay out a specific batter/pitcher/ballpark scenario to see how this works in practice.
-4 -3 -2 -1 0 +1 +2 +3 +4
1B x x 0.908 x 1.000 x x 1.182
2B 0.795 x x x 1.000 x x x 1.291
3B x 0.523 x x 1.000 x x x 1.868
HR/L 0.634 x x x 1.000 x x x 1.385
HR/R 0.636 x x x 1.000 x x x 1.374
PF 0.820 x x 1.000 x x x 1.370
-4 -3 -2 -1 0 +1 +2 +3 +4
1B 0.816 0.862 0.908 0.954 1.000 1.046 1.092 1.138 1.184
2B 0.800 0.850 0.900 0.950 1.000 1.050 1.100 1.150 1.200
3B 0.400 0.550 0.700 0.850 1.000 1.150 1.300 1.450 1.700
HR/L 0.640 0.760 0.840 0.920 1.000 1.080 1.160 1.240 1.320
HR/R 0.640 0.760 0.840 0.920 1.000 1.080 1.160 1.240 1.320
PF 0.800 0.850 0.900 0.950 1.000 1.050 1.100 1.150 1.200
4/30/2020 11:29 AM (edited)
I for one would love for you to walk through an example. And if you can clarify, based on your understanding, is the 1B multiplier for hits overall, or just for singles. I have always understood that it applies to hits overall (and mathematically I can't understand any other way for the numbers to make sense) but I recognize there is some disagreement on this point.
4/30/2020 9:58 AM
thats great stuff just4me, I would also love to see an example
4/30/2020 10:03 AM

-4 -3 -2 -1 0 +1 +2 +3 +4
1B x x 0.908 x 1.000 x x 1.182
2B 0.795 x x x 1.000 x x x 1.291
3B x 0.523 x x 1.000 x x x 1.868
HR/L 0.634 x x x 1.000 x x x 1.385
HR/R 0.636 x x x 1.000 x x x 1.374
PF 0.820 x x 1.000 x x x 1.370
-4 -3 -2 -1 0 +1 +2 +3 +4
1B 0.816 0.862 0.908 0.954 1.000 1.046 1.092 1.138 1.184
2B 0.800 0.850 0.900 0.950 1.000 1.050 1.100 1.150 1.200
3B 0.400 0.550 0.700 0.850 1.000 1.150 1.300 1.450 1.700
HR/L 0.640 0.760 0.840 0.920 1.000 1.080 1.160 1.240 1.320
HR/R 0.640 0.760 0.840 0.920 1.000 1.080 1.160 1.240 1.320
PF 0.800 0.850 0.900 0.950 1.000 1.050 1.100 1.150 1.200

I'm going to use the same example Paul used in his presentation, then add in the modifiers.

2000 Pedro Martinez vs 1923 Babe Ruth:
[H/AB=((AVG*OAV)/Lgavg)/((AVG*OAV)/LgAVG+(1-AVG)*(1-OAV)/(1-LGAVG))
Where, LgAVG=(PLgAVG+BLgAVG)/2]
Thus: H/AB=((.393*.167)/.2791)/((.393*.167)/.2791+(1-.393)*(1-.167)/(1-.2791))
Where, LgAVG=(.283+.276)/2], or .2791

Log5 result = .2504 This is the expected AVG for Ruth or OAV for Pedro in this matchup including normalization. If they had both been lefties or righties we then would've used the handedness modifier (new result would have been .2379, but that doesn't apply here). So in this case we apply the hit modifier (1B effect). For Coors that's a multiplier of 1.182, and the new result is .2959, for a -3 Park, like Petco, our modifier range is .862-.908, so in a worst case, that would be the original .2504*.862, or .2158. The next step if it is a hit is to determine what type of hit. WIS works backwards and starts with HR. The HR/H rate is calculated the same way as the H/AB but instead of AVG, OAV, LgAVG we use bHR/H, pHR/H, and LHR/H.

Thus: HR/H=((.200*.132)/.0805)/((.200*.132)/.0805+(1-.200)*(1-.132)/(1-.0805))
Where, LgHR/H=(.124+.037)/2], or .0805
Log5 result = .3027 (roughly 30% of the hits Ruth gets off of Pedro will be HRs. Now, in Coors, this wold be multiplied by the HR/RF (Sim assumes pull for hitter in calculations), so we take the .3027 and multiply the HR modifier of 1.374 to get a park adjusted rate of .4159 or roughly 41 HR per 100 hits off of Pedro in Coors.

This is HR/H, not HR/AB. The HR/AB for this matchup is simply multiplying the H/AB rate by the HR/H rate. (.2959*.4159) for a HR/AB of .1230 in Coors. In Petco we'd start with the -3 modifier (which puts us somewhere between .64-.76, so we'll use .7 for our estimate) and multiply the original outcome of .3027 by .7 to get the park adjusted HR/H rate of .2118 or roughly 21 HR per 100 hits or a (.2158*.2118) .0457 HR/AB in Petco (12.3 HR/AB in Coors & 4.57 HR/AB in Petco for this particular Batter/Pitcher matchup (7.58 HR/AB in neutral park)).

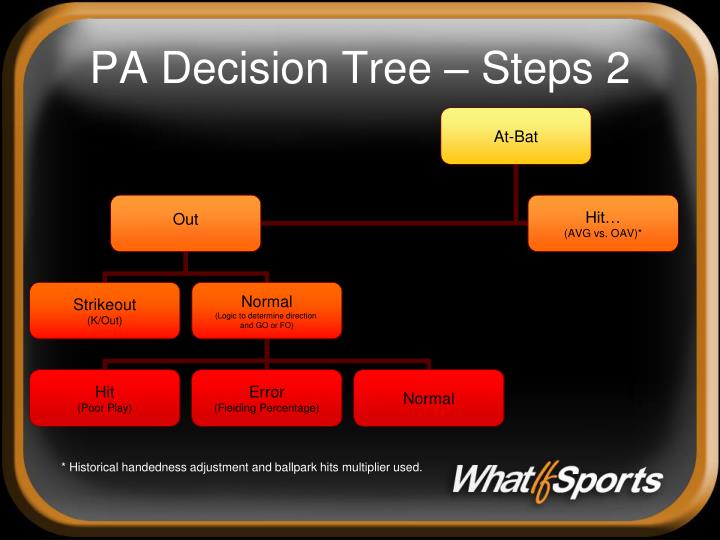
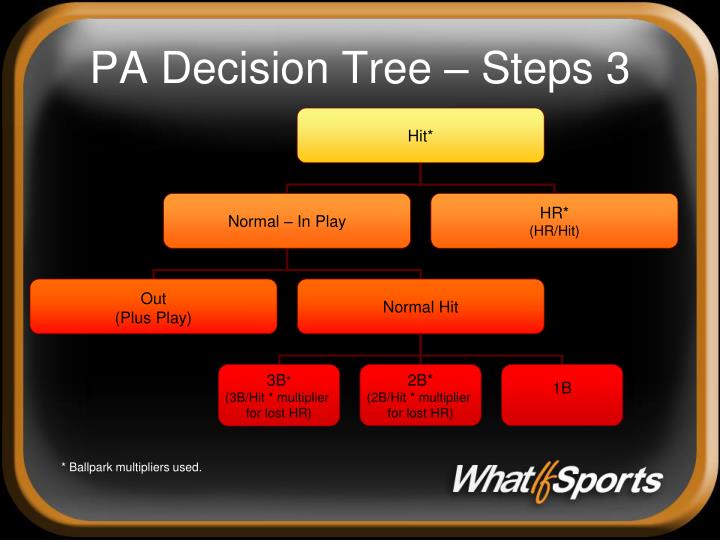
If it's not a HR, then using a regression from the pitcher ERA and the batters 3B/H and 2B/H, the SIM works to see if it's a + play on defense , or a triple or double the same as the HR above and uses the park effects the same way. Any hits that didn't become HR, + play, 3B, or 2B are singles.
4/30/2020 12:32 PM (edited)
Excellent. Thank you.

OK, assuming just4me's descriptions are correct, then it is clear that the Park 1B rating affects overall hits, NOT singles.
4/30/2020 12:41 PM
Posted by contrarian23 on 4/30/2020 12:41:00 PM (view original):
Excellent. Thank you.

OK, assuming just4me's descriptions are correct, then it is clear that the Park 1B rating affects overall hits, NOT singles.
For me, the clearest indicator of this being correct is that the 1B modifier on park effects is applied at the beginning of Decision Tree Step 3 and no modifier is applied at the 1B point of the Decision Tree Step 3.
4/30/2020 12:49 PM
I have always wondered why Rogers Center is at 1.03 with -2/+2/0/+1/+1 while Riverfront is 0.90 with the same -2/+2/0/+1/+1.

Any insight?
4/30/2020 2:25 PM
none whatsoever
4/30/2020 2:28 PM
Posted by FatDad on 4/30/2020 2:25:00 PM (view original):
I have always wondered why Rogers Center is at 1.03 with -2/+2/0/+1/+1 while Riverfront is 0.90 with the same -2/+2/0/+1/+1.

Any insight?
Two questions from that:

1. Could it be that they are reflecting that each of those +/- numbers actually is a range so one of those parks has more at one edge of the ranges and is therefore pulling the overall rating there?

2. Is there somewhere on the decision tree where that single park factor number factors in? Or is it just a representation of the cumulative effect of all the individual 1B/2B/3B/HR ratings?
4/30/2020 2:56 PM
Posted by FatDad on 4/30/2020 2:25:00 PM (view original):
I have always wondered why Rogers Center is at 1.03 with -2/+2/0/+1/+1 while Riverfront is 0.90 with the same -2/+2/0/+1/+1.

Any insight?
The Park Effect deal with the run scoring environment and the ratings deal with the modifiers above for each hit type event. Those ratings could be on opposite sides of the respective bounds with Riverfront on the least hitter friendly variant of each modifier within the rating (i.e., .908 1B modifier for Riverfront and .954 for Rogers).

Ultimately the Park Factor isn’t used at all in the sim, but is a reflection of the overall run scoring environment for the ballpark. Essentially, Riverfront suppresses run scoring by roughly 10% and Rogers sees about a 3% gain in run scoring over neutral parks.
4/30/2020 3:01 PM
◂ Prev 1234 Next ▸
Exploring Park Effects Topic

Search Criteria

Terms of Use Customer Support Privacy Statement

© 1999-2024 WhatIfSports.com, Inc. All rights reserved. WhatIfSports is a trademark of WhatIfSports.com, Inc. SimLeague, SimMatchup and iSimNow are trademarks or registered trademarks of Electronic Arts, Inc. Used under license. The names of actual companies and products mentioned herein may be the trademarks of their respective owners.